Worked examples are illustrative and are not sealed engineering documents. Site-specific analysis requires a licensed engineer in the relevant jurisdiction. Regulatory references to other jurisdictions (e.g. California) are descriptive. Valerio Oricchio P.E.
1. The question
In July 2022 Saudi Arabia presented The Line as a 200 m wide, 170 km long structure, 500 m tall, for nine million people, with no roads or cars, every daily need within a five-minute walk, and a high-speed rail link “with an end-to-end transit of 20 minutes” [2]. Few urban projects have published such precise transport numbers. That makes them testable.
This article does not ask whether The Line is a good idea, and it does not try to forecast what will be built. It asks a narrower engineering question: are the published transport claims consistent with each other and with known physics, geometry and transit capacity? The checks use public numbers and a short Python script; Section 9 turns them into a review checklist for any megaproject transport study.
2. What was claimed, and what is happening now
The claims (2021–2022).
| Date | Source | Claim |
|---|---|---|
| 11 Jan 2021 | NEOM press release [1] | “A city of a million residents with a length of 170 km”; “zero cars, zero streets and zero carbon emissions”; essential services “within a five-minute walk”; “It is expected no journey will be longer than 20 minutes.” |
| 25 Jul 2022 | PIF / NEOM release [2] | “200-meter-wide, 170-kilometer-long structure set 500 meters above sea level”; “will eventually accommodate nine million people”; “built on a footprint of just 34 square kilometers”; “without roads, cars or emissions”; “all facilities within a five-minute walk”; “a high-speed rail – with an end-to-end transit of 20 minutes.” |
Two details matter for the checks. First, the 2021 wording (“no journey longer than 20 minutes”) reads as a door-to-door promise; the 2022 wording is a rail end-to-end time. Second, a train speed of 510 km/h is often quoted alongside the 20-minute figure; it is widely reported from NEOM promotional material [12] but does not appear in the two releases cited here.
The status (2024–2026). All dates are publication dates.
- 5 April 2024, Bloomberg (as reported by Dezeen [3]): officials expected fewer than 300,000 residents at The Line by 2030, down from earlier estimates of 1–1.5 million, and one source said only 2.4 km of the 170 km would be completed by 2030. Bloomberg added that “officials have maintained their overall objectives for The Line.”
- 12 November 2024, NEOM: the board announced “the appointment of Eng. Aiman Al-Mudaifer as Acting CEO”, replacing Nadhmi Al-Nasr [4].
- 14 July 2025, Bloomberg: a unit of the sovereign wealth fund “asked consulting firms to conduct a strategic review” of The Line, “as the kingdom assesses priorities for its project-related expenditures” [5]. On 18 July 2025 CNBC reported that NEOM confirmed the review and called it “common practice” for long-term megaprojects [6].
- 6 November 2025, Financial Times: “End of The Line: how Saudi Arabia’s Neom dream unravelled”, based on interviews with former NEOM staff and senior officials [7].
- Late January 2026, Financial Times (reported by Fast Company, Archinect and DCD, 27 Jan–3 Feb [8]): the review was expected to recommend a “substantially smaller and more pragmatic version”, reusing infrastructure already built; officials told the FT the project would become a “far smaller” development supporting “industrial” uses, and NEOM pointed to data and AI tenants.
- 26 January and 5 February 2026, Olympic Council of Asia (as reported by Dezeen [9]): the 2029 Asian Winter Games, planned for NEOM’s Trojena mountain resort, were first postponed and then awarded to Almaty, Kazakhstan.
- 15 April 2026, PIF Governor Yasir Al Rumayyan, Al Arabiya TV (reported by Argaam [10]): no NEOM project had been cancelled; the developer had been told to reprioritise; “there is a common misconception that The Line represents NEOM as a whole”; Oxagon is the current investment focus; asked whether The Line must be finished by 2030, he replied: “I believe not.”
- 22 May 2026, Semafor (exclusive, citing “people familiar with the matter”): NEOM has delayed further work on The Line “until at least after 2030”, Trojena will receive no new investment until after 2030, about $3 billion will go to Oxagon, and the 2030 population target was lowered to up to 100,000. NEOM “did not immediately respond to a request for comment” [11].
No official 2026 statement reviewed here gives a new length, population or transport concept for The Line. The checks below therefore test the 2022 claims as published, and Section 7 asks what a smaller linear development could keep from them.
3. Speed check: 170 km in 20 minutes
The arithmetic is simple: 170 km in 20 minutes is an average of 510 km/h, start to stop, including any intermediate stops.
How does that compare with operating or planned systems?
- Shanghai maglev: about 30 km, run in 7 min 20 s at 431 km/h top speed until May 2021, an average of roughly 245–250 km/h; it now runs at 300 km/h in 8 min 10 s [13]. A short line spends a large share of its time accelerating and braking.
- Chuo Shinkansen (JR Central, under construction): 285.6 km Shinagawa–Nagoya in at most 40 minutes, designed for 500 km/h in service (505 km/h maximum design speed) [14]. That is an average of 428 km/h non-stop, over a longer distance than The Line. At that average, 170 km takes about 24 minutes. JR Central said in March 2024 that the 2027 opening could not be achieved and that it cannot currently predict a new date [14].
So 510 km/h average is above the best planned non-stop service. The kinematics show why. With a trapezoidal speed profile (constant acceleration a, cruise, constant braking a), each stop costs roughly v/a seconds of lost time plus the dwell. At 500 km/h and 1 m/s², that is about 139 s per stop before dwell.
| Top speed, acceleration | Non-stop | 2 stops | 5 stops | 10 stops |
|---|---|---|---|---|
| 500 km/h, 1.0 m/s² | 22.7 min (449 km/h) | 29.3 min | 39.3 min | 55.6 min |
| 600 km/h, 1.0 m/s² | 19.8 min (516 km/h) | 27.3 min | 38.7 min | 55.6 min |
| 500 km/h, 0.5 m/s² | 25.0 min (408 km/h) | 36.3 min | 52.6 min | 74.5 min |
60 s dwell per stop, equal spacing; own calculation.
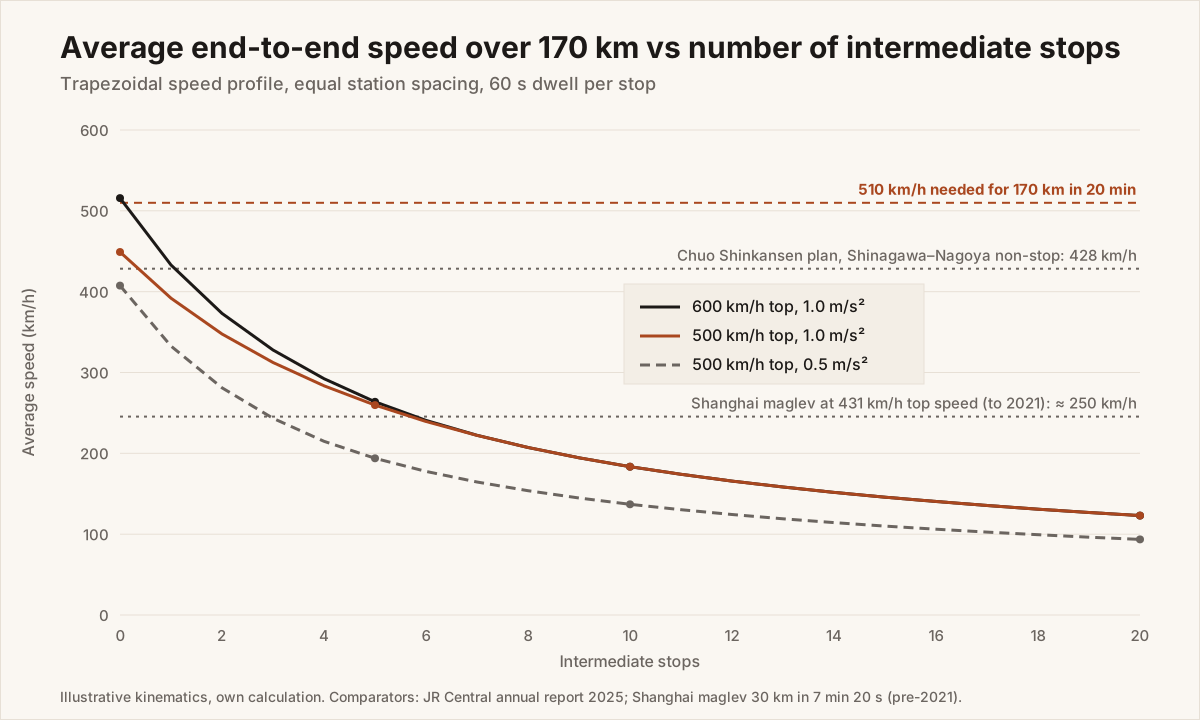
Three results follow:
- Non-stop at 1 m/s², the train needs a cruise speed of about 591 km/h to make 20 minutes. At 0.5 m/s², closer to what seated passengers usually accept on high-speed rail, it needs about 825 km/h.
- With even one intermediate stop, 20 minutes is impossible at 1 m/s² with a 60 s dwell, at any top speed: the best case, accelerating to the midpoint and braking, already takes 2 × 2√(85,000/1) ≈ 1,166 s, plus the dwell.
- Beyond about 8 stops, top speed no longer matters: the 500 and 600 km/h curves merge because the train never reaches cruise between stations.
The claim can be met only as a non-stop, end-to-end express at roughly 600 km/h cruise, with the alignment to support it (curve radius and gradient then drive the cost of very high speed). A city of 9 million along 170 km needs many stations, so the realistic design is a layered system: a stopping service for most trips and a limited-stop express for the few long ones, which then do not take 20 minutes door to door. The 2021 promise that “no journey will be longer than 20 minutes” is not achievable for end-to-end trips once access, waiting and vertical travel are added.
4. Density and trip geometry
Density. Nine million residents on 34 km² is about 265,000 residents per km². For comparison:
| Area | Residents per km² | Source |
|---|---|---|
| The Line as announced | 264,706 | own arithmetic from [2] |
| Hong Kong, Kwun Tong district (densest district) | 59,280 | [16] |
| Manhattan (New York County), 2020 Census | 28,873 (74,782 per sq mi) | [15] |
| Hong Kong, whole territory | 6,900 | [16] |
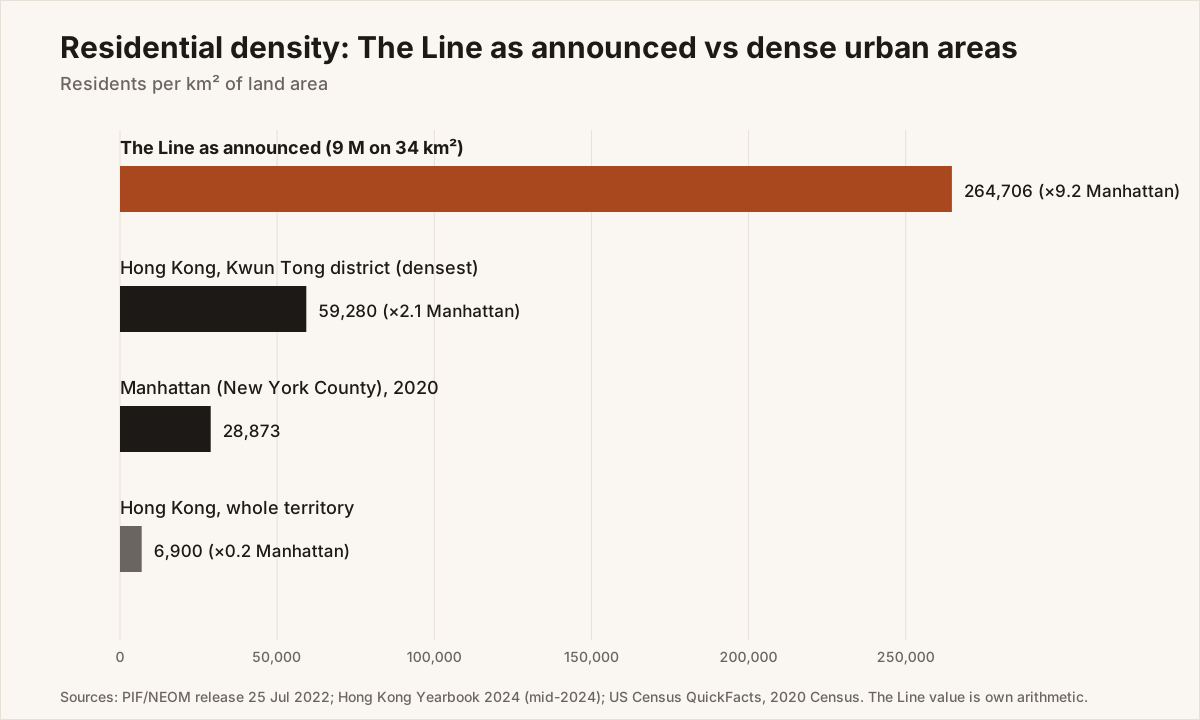
That is about 9 times Manhattan and 4.5 times the densest district of Hong Kong. Height makes it possible on paper: a 500 m structure can hold over 100 storeys. But land density sets transport demand per kilometre: about 53,000 residents per km of line. The 2024 target of fewer than 300,000 people on 2.4 km [3] would mean about 125,000 per km, even denser; the 2026 target of up to 100,000 [11] on the same length would still be about 42,000 per km.
Trip geometry. Shape matters as much as density. For two points chosen at random:
- on a segment of length L, the mean distance is L/3: 56.7 km for 170 km;
- in a disc of radius r, the mean distance is 128r/(45π) ≈ 0.905r. A disc of 34 km² has r = 3.29 km and a mean trip of 2.98 km.
Same land, same population, 19 times the average trip length. On the line only 5.8% of random trips are shorter than 5 km; in the disc, 91.3% are (Monte Carlo check, 400,000 pairs).
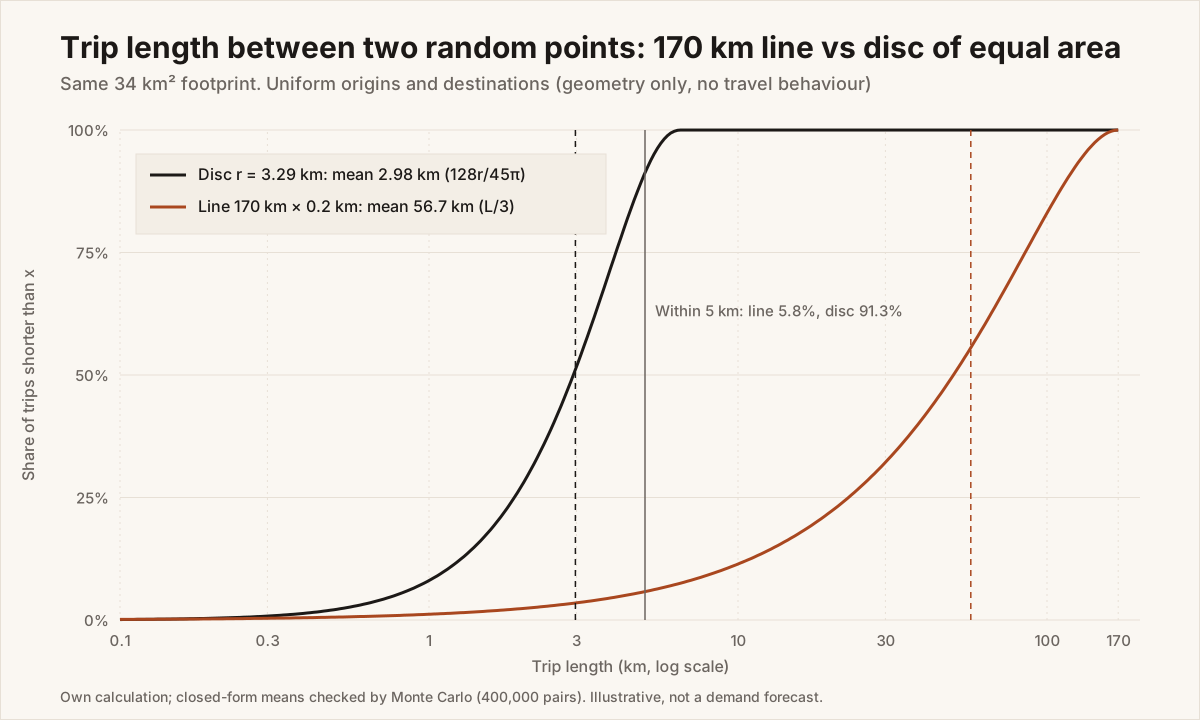
Real trips are not random, and the “five-minute walk” premise aims to keep them local. But geometry sets the penalty for every trip that is not: jobs, hospitals, universities and stadiums are not in every module. In a disc, a specialised destination at the centre is at most one radius away (3.3 km). On a line, the same destination at the midpoint is up to 85 km away for half the residents.
5. Line capacity check
How much would the spine carry? The method follows the TCQSM [21]: demand at the peak load point compared with trains per hour × passengers per train. All inputs below are illustrative assumptions, not NEOM data.
Demand. 9 million residents × 2.5 trips per day × 10% in the peak hour = 2.25 million peak-hour trips. If every trip used the line:
- With uniform origins and destinations, half of all trips cross the midpoint, a quarter in each direction: 562,500 passengers per hour per direction (pphpd).
- With shorter trips, the average load along the line is peak-hour trips × mean trip length / (2 × 170 km): about 33,000 pphpd at 5 km, 66,000 at 10 km and 132,000 at 20 km.
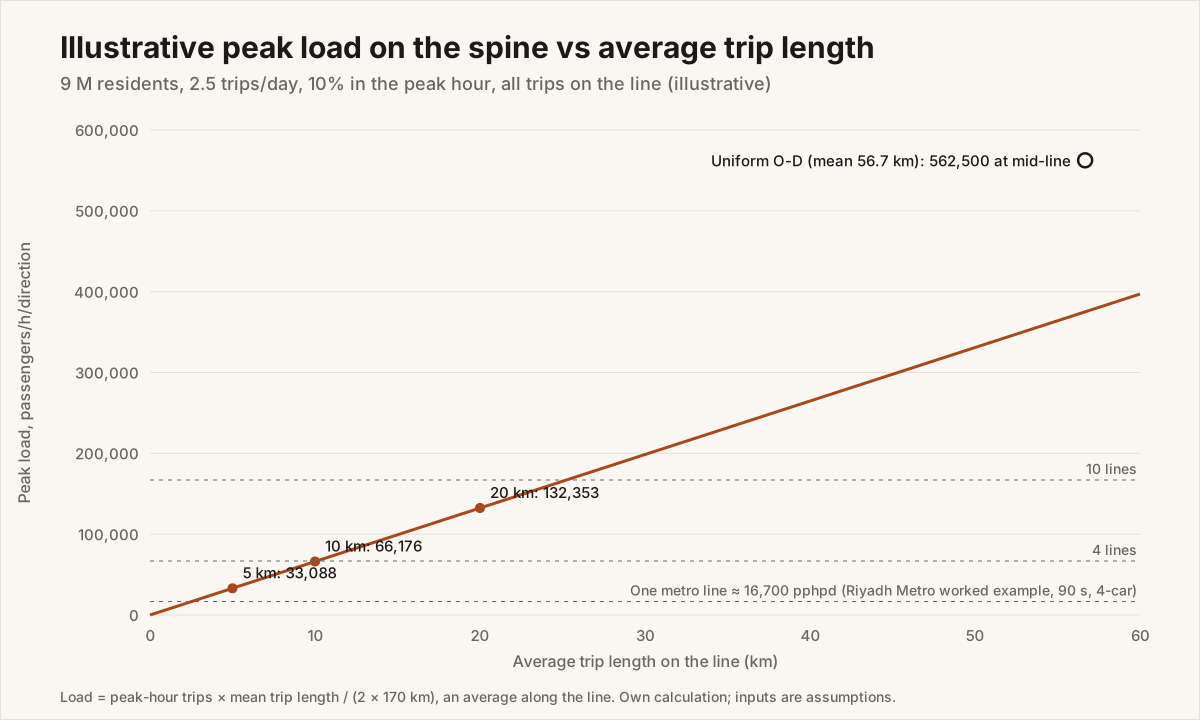
Supply. A driverless metro line with four-car trains every 90 s (order of magnitude of the Riyadh Metro design) gives about 16,700 pphpd design capacity (TCQSM method; about 520 passengers per train, peak-hour factor 0.80). Even the 10 km case needs about four such lines in parallel; the uniform case needs about 34. For the express layer, two constraints apply:
- Train size. Assume an illustrative 1,300 seats per high-speed train (order of magnitude of a long high-speed set; assumption). At 66,000 pphpd the express would need 51 trains per hour, one every 71 s; at 562,500 pphpd, one every 8 s.
- Headway at speed. Braking distance grows with v². From 500 km/h at 1 m/s² it is 9.6 km; at 0.5 m/s², 19.3 km. A simple plain-line headway (train length + braking distance, at line speed, + 30 s margin) gives about 100–170 s, i.e. 21–35 trains per hour per track. At stations, dwell and acceleration add more, as in any timetable-based capacity check (see UIC 406 capacity).
The conclusion holds across the range of assumptions tested: a 20-minute express can serve only a small share of trips. The bulk must be short, local trips on foot, on a stopping metro, or on horizontal people movers, and land uses must be arranged so that most trips stay within a few kilometres. That is a land-use requirement, not a rolling-stock one.
6. Vertical transport and freight
Vertical. A 500 m structure makes every trip partly vertical. The fastest elevator in service, at Shanghai Tower, runs at 1,230 m/min (20.5 m/s) and goes from B2 to floor 119 in 53 s [18]. Most high-rise lifts are much slower; tall buildings use sky lobbies and zoned banks, a topic covered in CIBSE Guide D [20]. As a sizing check, take a residential criterion of 8% of the population moved in 5 minutes, two-way, with an interval below 40 s, as used in one university design standard [19]. At 53,000 residents per km, that is about 4,200 people per 5 minutes per km. With 21-person cars and an assumed 200 s round trip, each car moves about 32 people per 5 minutes, so about 130 cars per km, or about 23,000 lifts over 170 km (illustrative). The shafts are a small share of a 200 m-wide floor plate; the issue is that every trip to the spine adds a vertical leg and a wait, which a 20-minute budget cannot absorb.
Freight and servicing. A car-free city still has to move goods. At an illustrative 10 kg per resident per day of food, retail, parcels, construction materials and waste (assumption), 9 million people generate about 90,000 t per day: some 4,500 loads of 20 t, or about 530 t per km per day. A car-free design must provide, from the outset:
- a dedicated goods level or tunnel, with consolidation centres at the ends and along the line;
- night or off-peak freight windows on the rail spine, which compete with maintenance;
- waste removal (vacuum or containerised) and bulk deliveries for construction and fit-out;
- emergency access for fire and ambulance services, and evacuation routes from a 500 m structure.
These systems shape the cross-section as much as the passenger railway, and are absent from the headline claims.
7. What would make it work: lessons for linear corridors
Linear cities are not new. On 27 November 1882 Arturo Soria y Mata published “La línea recta” in El Progreso, proposing a linear city along a tramway. His Compañía Madrileña de Urbanización, founded in 1894, built a first section in Madrid along a 40 m wide main street about 5.2 km long, served by an electric tram [17]. Soria’s plan was 50 km for 30,000 people [17]: 600 residents per km, about 90 times less than The Line’s 53,000. His tram served low-rise suburbs; The Line’s spine would have to serve a metropolis.
Five lessons follow for any linear development, including a scaled-down Line:
- Make the modules self-sufficient. The trip-length penalty of a line is paid only by trips that leave the module. Place jobs, schools and health care so that most trips stay within 2–3 km.
- Design a layered transit system. A stopping metro with stations every 1–2 km for local trips, an express with few stops for long trips, and walking and horizontal movers for the last few hundred metres. Publish the door-to-door time, not the in-vehicle time.
- Size capacity on the peak load point, not the average. Put specialised destinations (hospital, university, stadium) where they spread the load, not all at the midpoint.
- Plan freight, servicing and emergency access as first-order systems. They take space in the section and time on the track.
- Build in phases that work on their own. A 2.4 km first phase is a district, not a slice of a 170 km city. It needs its own transport logic and an external link (road, rail or both), because the spine it was designed to sit on does not yet exist.
8. Limits
- Claims, not designs. The checks use public claims [1][2]; NEOM has not published a transport model, operating plan or station spacing in the sources reviewed.
- Status reporting relies on press reports, several based on unnamed sources [3][5][7][8][11]. Official statements in 2025–2026 confirm a review and reprioritisation [6][10] but give no new figures.
- Illustrative demand inputs. Trip rate (2.5 per day), peak share (10%), mean trip lengths, train size (1,300 seats), lift round trip (200 s) and freight rate (10 kg per resident per day) are assumptions chosen to show orders of magnitude.
- Simplified kinematics. Constant acceleration and braking, equal station spacing, no gradients, curves, jerk limits or air resistance. Real running times would be longer.
- Geometry ignores behaviour. Random-point distances show the shape penalty, not a forecast; a gravity model with real land uses would give shorter trips.
- Vertical transport criteria. The check uses one published design criterion [19] and a manufacturer’s speed record [18]; a full study would apply CIBSE Guide D [20].
9. Checklist for reviewing megaproject transport claims
- Convert every headline time into an average speed and compare it with operating systems, not prototypes.
- Ask whether the time is door to door or in-vehicle, and add access, waiting and vertical legs.
- Check the stopping pattern: how many stations, what dwell, what acceleration, and does the time survive them?
- Compute land density per km² and per km of corridor, and compare it with real cities from official statistics.
- Compute the mean trip length implied by the city’s shape, and test how much demand must stay local.
- Estimate peak load at the critical section with stated trip rates and peak factors, and show the sensitivity.
- Compare that load with design capacity per TCQSM (headway, train size, standing density, peak hour factor).
- Check the headway physics at the proposed speed: braking distance, block or moving-block separation, station throat limits.
- Ask for the freight, servicing, waste and emergency-access plan, with volumes and space.
- Check that each construction phase is functional on its own, with its own transport links.
Our transit and rail services cover capacity, operations and alignment reviews.
For an independent review of a transit or megaproject transport study, see peer review or get in touch.
import math
L = 170_000                                   # m
print(L / 1200 * 3.6)                         # 510 km/h average for 20 min
def t(n, vk, a, dwell=60):                    # n intermediate stops, trapezoidal profile
    v, s = vk / 3.6, L / (n + 1)
    ts = s / v + v / a if s >= v * v / a else 2 * math.sqrt(s / a)
    return (n + 1) * ts + n * dwell
for vk, a in ((500, 1), (600, 1), (500, .5)):
    print(vk, a, [round(t(n, vk, a) / 60, 1) for n in (0, 2, 5, 10)])
for a in (1, .5):                             # cruise needed non-stop: v^2 - aTv + aL = 0
    print(a, round((a*1200 - math.sqrt((a*1200)**2 - 4*a*L)) / 2 * 3.6))
print(2 * 2 * math.sqrt(85_000) + 60)         # 1 stop, unlimited speed, a = 1: > 1200 s
print(285.6 / 40 * 60, 30 / (7 + 20/60) * 60) # Chuo and Shanghai maglev averages
d = 9e6 / 34; print(round(d), round(d / (74781.6 / 2.589988), 1), round(d / 59280, 1))
r = math.sqrt(34 / math.pi); print(170 / 3, 128 * r / (45 * math.pi))
pk = 9e6 * 2.5 * 0.10                         # peak-hour trips (illustrative)
print(pk * 0.25, [round(pk * m / 340) for m in (5, 10, 20)])
for b in (1, .5):                             # 500 km/h plain-line headway
    v = 500 / 3.6; print(b, round((400 + v*v/(2*b)) / v + 30))
hc = 0.08 * 9e6 / 170; print(round(hc), round(hc / (21 * 300 / 200) * 170))
print(9e6 * 10 / 1000, 30000 / 50)            # freight t/day; Soria residents per km
Sources
- NEOM. “HRH Prince Mohammed bin Salman announces THE LINE at NEOM”, press release, 11 January 2021 (via Kyodo News PR Wire). https://kyodonewsprwire.jp/index.php/release/202101119548
- Public Investment Fund. “Saudi Arabia’s NEOM to deliver urban community-of-the-future at THE LINE”, 25 July 2022. https://pif.gov.sa/en/news-and-insights/newswire/2022/saudi-arabias-neom-to-deliver-urban-community-of-the-future-at-the-line
- Dezeen. “Saudi Arabia lowers predicted number of residents at The Line by 2030”, 8 April 2024, reporting Bloomberg, 5 April 2024. https://www.dezeen.com/?p=2055055
- NEOM. “NEOM Board of Directors Announces Leadership Change”, 12 November 2024. https://www.neom.com/en-us/newsroom/neom-board-of-directors-announces-leadership-change
- Bloomberg. “Saudis Plan Strategic Review of Futuristic ‘Line’ City Project”, 14 July 2025. https://news.bloomberglaw.com/mergers-and-acquisitions/saudis-plan-strategic-review-of-futuristic-line-city-project
- CNBC (N. Turak), via NBC New York. “Saudi Arabia reckons with its costly megaprojects as $500 billion ‘The Line’ is reviewed”, 18 July 2025. https://www.nbcnewyork.com/news/business/money-report/saudi-arabia-reckons-with-its-costly-megaprojects-as-500-billion-the-line-is-reviewed/6340691/
- Financial Times. “End of The Line: how Saudi Arabia’s Neom dream unravelled”, 6 November 2025 (paywalled). https://www.ft.com/saudi-neom-line
- Fast Company (J. Diaz). “Saudi Arabia’s The Line is collapsing into a hyphen”, 27 January 2026, reporting the Financial Times. https://fastcompany.com/91481217/saudi-arabias-the-line-is-collapsing-into-a-hyphen ; Archinect. “The Line to be ‘radically scaled back’ after new review”, 30 January 2026, reporting the Financial Times. https://archinect.com/news/article/150522289/the-line-to-be-radically-scaled-back-after-new-review ; Data Center Dynamics, “Saudi Arabia’s ‘Neom’ megaproject could be redesignated as a data center hub”, 3 February 2026. https://www.datacenterdynamics.com/en/news/saudi-arabias-neom-megaproject-could-be-redesignated-as-a-data-center-hub/
- Dezeen. “Almaty officially replaces Neom as host of 2029 Asian Winter Games”, 6 February 2026. https://www.dezeen.com/2026/02/06/neom-replaced-almaty-asian-winter-games-2029/
- Argaam. “PIF Governor says no projects canceled in NEOM so far”, 15 April 2026 (Al Arabiya interview). https://www.argaam.com/en/article/articledetail/id/1896867
- Semafor (M. Martin). “Exclusive / Saudi’s NEOM halts work on The Line until after 2030”, 22 May 2026. https://www.semafor.com/article/05/22/2026/saudis-neom-halts-work-on-the-line-until-after-2030
- Wikipedia. “The Line, Saudi Arabia”, accessed 21 October 2026 (secondary). https://en.wikipedia.org/wiki/The_Line,_Saudi_Arabia
- Wikipedia. “Shanghai maglev train”, accessed 21 October 2026. https://en.wikipedia.org/wiki/Shanghai_maglev_train
- Central Japan Railway Company. Annual Report 2025, Chuo Shinkansen section. https://global.jr-central.co.jp/en/company/ir/annualreport/_pdf/annualreport2025-12.pdf
- US Census Bureau. QuickFacts, New York County, New York (2020 Census population and land area). https://www.census.gov/quickfacts/fact/csv/newyorkcountynewyork/POP010220
- Hong Kong SAR Government. Hong Kong Yearbook 2024, “Facts”. https://www.yearbook.gov.hk/2024/en/pdf/Facts.pdf
- Navascués Palacio, P. La Ciudad Lineal de Arturo Soria (esMadrid). https://w3.esmadrid.com/sites/default/files/la_ciudad_lineal_de_arturo_soria_pedro_navascues_palaciopdf.pdf
- Mitsubishi Electric. News release on the Shanghai Tower elevator (1,230 m/min), 10 May 2016. https://mitsubishielectric.com/news/2016/0510.html
- The University of Queensland. Design Standard DS-11 Vertical Transportation, Rev. 2, Section 2.6. https://coo.uq.edu.au/files/31545/DS-11_Vertical%20Transportation_R2.pdf
- CIBSE. Guide D: Transportation systems in buildings (2020; 2025 revision previewed at the CIBSE Lifts Group seminar 2023). https://www.cibse.org/media/5a4lpbwp/chapter-3-4-9-a2.pdf
- Transportation Research Board. Transit Capacity and Quality of Service Manual, Third Edition, TCRP Report 165, 2013, Chapter 3. https://onlinepubs.trb.org/onlinepubs/tcrp/tcrp_rpt_165ch-03.pdf (Concepts from Chapter 3 of the 3rd edition; a 4th edition, TCRP Research Report 262, was published in 2026: https://www.nationalacademies.org/publications/29449)
Need this applied to your corridor?
Send the study scope and the data you have. You will get a reply within two working days.
Discuss a project