Worked examples are illustrative and are not sealed engineering documents. Site-specific analysis requires a licensed engineer in the relevant jurisdiction. Regulatory references to other jurisdictions (e.g. California) are descriptive. Valerio Oricchio P.E.
1. The problem
In 2025, 2,868 people died on Italian roads within 30 days of a crash: 5.3% fewer than in 2024 and 9.6% fewer than in 2019 [1]. Apart from the 2020 lockdown year, it is the lowest figure in the series that starts in 2010 [1]. But the decline is uneven. Pedestrian deaths fell to 419 (−10.9%), while deaths of riders on conventional bicycles rose to 198 (+20%) and on e-bikes to 30 (+50%); 25 e-scooter riders were killed (+8.7%) [1][3]. Vulnerable road users (pedestrians, cyclists, micromobility and powered two-wheeler users) made up 53.3% of deaths, up from 51.8% in 2024 [3].
Italy has 48.7 road deaths per million inhabitants against an EU-27 average of 43.4, and ranks 20th of 27 countries [1]. The National Road Safety Plan (PNSS) 2030 aims to halve deaths from the 2019 level, to 1,587 [1]. At the 2019–2025 pace, Italy will not get there.
This article brings together the latest data on how Italians travel and how pedestrians and cyclists are killed, compares Italy with the EU, the United States, Latin America and Asia, summarises the rules introduced since 2017, and ends with an engineering reading of countermeasures, the limits of the data, and a checklist for practitioners.
2. Context: travel and mode split in Italy
Italy is a country of short trips made by car. According to Isfort’s Audimob survey (population aged 14–85, average weekday), in 2024 32.5% of trips were under 2 km and 78.0% under 10 km [4]. Yet the car carries 61.1% of trips, against 21.8% on foot, 4.3% by bicycle or micromobility, 3.7% by motorcycle and 9.1% by public transport [4]. The “sustainable mobility rate” (walking + cycling + public transport) returned to 35.1% in 2024, back to its 2019 level (35.0%) after a low of 31.1% in 2023; in the first half of 2025 it was 34.7% [4].
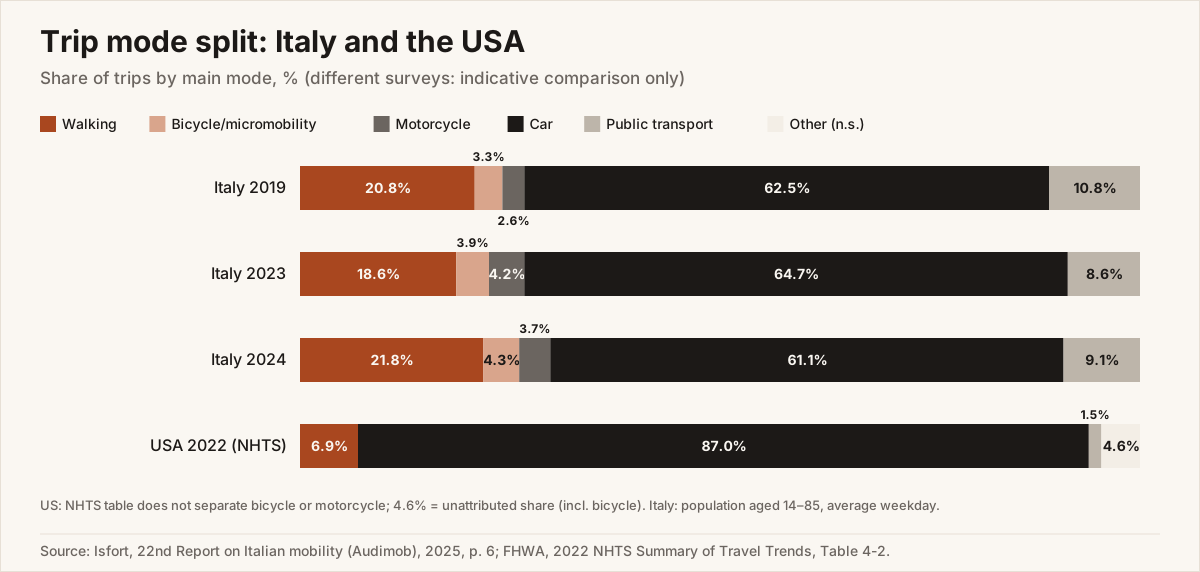 Source: Isfort, 22nd Audimob Report (2025) [4]; FHWA, 2022 NHTS [27].
Italy’s car fleet is the densest in the EU: 701 cars per 1,000 inhabitants in 2024, against an EU-27 average of 578 [5]. That is the setting for walking and cycling: urban streets designed for motor traffic, with a lot of on-street parking.
The United States gives a sense of scale. In the 2022 NHTS, private vehicles account for 87.0% of trips, walking 6.9% and public transit 1.5% [27]. For commuting (ACS 2024), 2.4% walk and 0.5% cycle [28]. Pedestrian and cyclist exposure in Italy is therefore much higher, which matters when comparing death rates (§4 and §7).
The cycling network is growing but uneven. In the 109 provincial capitals, cycle paths totalled 5,758.9 km in 2023 (+6.4% on 2022, +27.4% over five years), with an average density of 29.7 km per 100 km² of land area: 69.9 in the North, 19.2 in the Centre and 7 in the South [6].
3. The numbers: pedestrian and cyclist casualties
3.1 Trends
Figure 2 compares total deaths and the two groups of interest, indexed to 2010 = 100.
- Total: from 4,114 deaths in 2010 to 3,173 in 2019 and 2,868 in 2025 (−30.3% on 2010) [1].
- Pedestrians: 419 deaths in 2025; −32.5% since 2010 and −21.5% since 2019 [1][3]. In 2024 there were 470 [2].
- Cyclists: 198 deaths on conventional bicycles and 30 on e-bikes in 2025, 228 in all; in 2024 there were 185 (165 + 20) [1][2]. Including e-scooters (253 deaths in 2025, the same as in 2019), ISTAT reports −4.5% since 2010 and “no progress since 2019” [1][3].
- E-scooters: 25 riders killed in 2025 (23 in 2024, 21 in 2023); e-scooter crashes numbered 4,130 (+6%) [1][2].
- Motorcyclists: 802 deaths in 2025 (−3.4% on 2024), but +14.9% since 2019 [1].
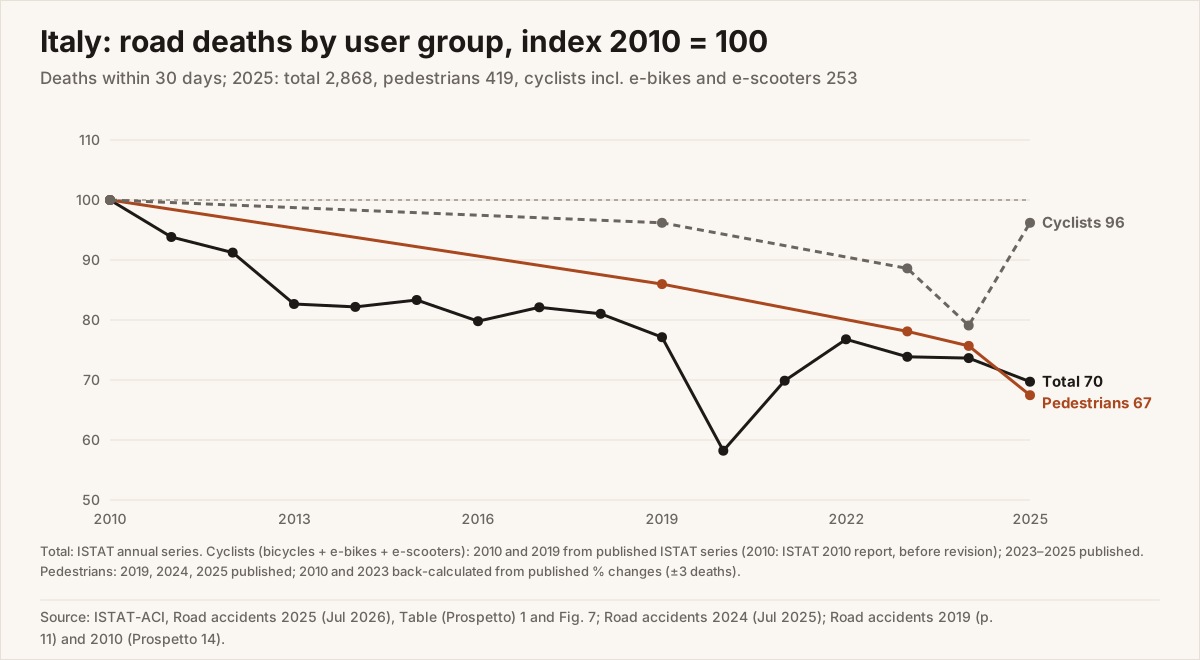 Source: ISTAT-ACI 2025 and 2024 [1][2]; ISTAT, Road accidents 2010 and 2019. Cyclists incl. e-bikes and e-scooters: 2010 and 2019 from published ISTAT series, 2023–2025 from the ISTAT-ACI reports. Pedestrians: 2010 and 2023 back-calculated from published percentage changes.
In short: pedestrians follow, and in 2025 outpace, the overall decline; cyclists have not improved in fifteen years. The share of trips by bicycle and micromobility has grown (from 3.3% in 2019 to 4.3% in 2024 [4]), so part of the increase may reflect more exposure. Without cycling distance data, it is not possible to say how much.
3.2 Urban and rural
In 2025, 1,209 people died on urban roads, 1,401 on rural roads and 258 on motorways [1]. The urban share of deaths is 42.2%, against an EU average of 38.2% in 2024 [19]. Urban roads account for 72.9% of crashes but with a low fatality index (0.9 deaths per 100 crashes, against 3.6 on rural roads) [1][3]. Pedestrian and cyclist safety is decided mainly in urban areas, where most walking and cycling takes place.
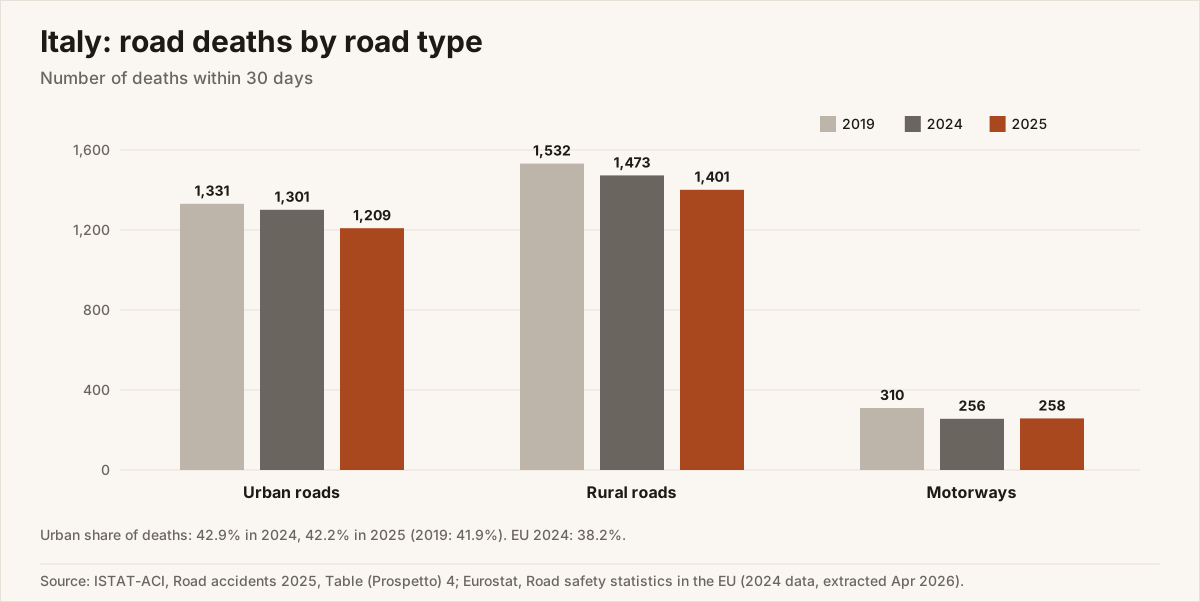 Source: ISTAT-ACI 2025, Table (Prospetto) 4 [1]; Eurostat [19].
3.3 Severity and age
The fatality index by user group (deaths per 100 injury crashes involving the group) measures vulnerability: 2.4 for pedestrians, 1.6 for motorcyclists, about 1.0 for cyclists and e-scooter riders, and 0.6 for car occupants [1][3].
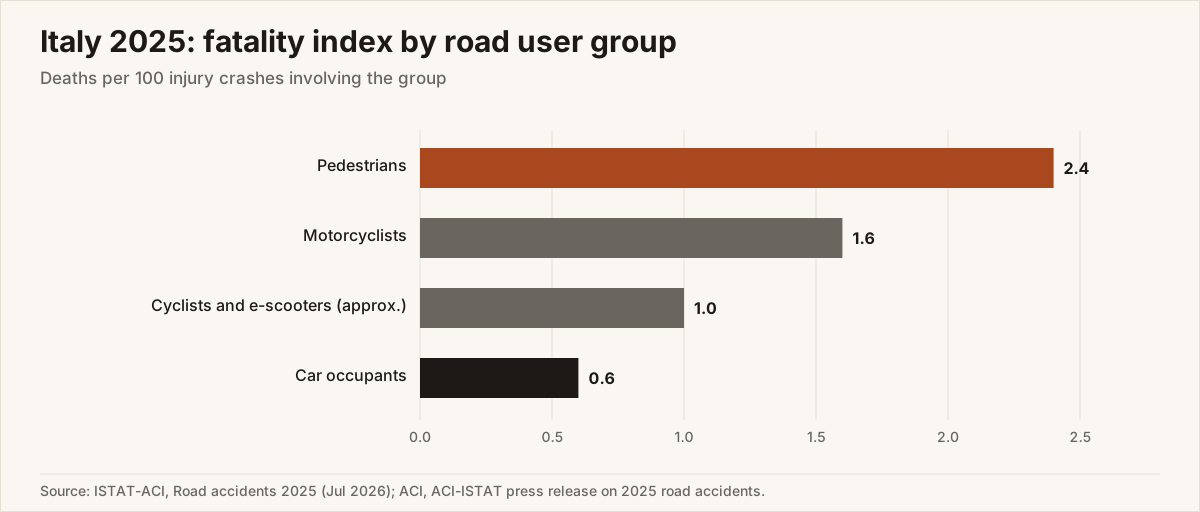 Source: ISTAT-ACI 2025 [1]; ACI [3].
ISTAT’s 2025 report does not break down pedestrian deaths by age; its age table covers all road users [1]. The highest death rates are at ages 85–89 (90.4 per million) and 80–84 (82.8), followed by 20–24 (77.1) [3]. Eurostat reports that people aged 65 and over were 31.0% of Italy’s road deaths in 2024 [19]. In 2025, 33 children aged 0–14 were killed (29 in 2024) [3].
4. International comparison
Table 1 summarises rates and the composition of deaths. Values marked * are WHO or PAHO modelled estimates, not national counts.
| Area | Year | Deaths per million inhabitants | % pedestrians | % cyclists | % powered two-wheelers | Notes |
|---|---|---|---|---|---|---|
| Italy | 2025 | 48.7 | 14.6 | 8.8 | 29.9 | cyclists incl. e-bikes and e-scooters; PTW = motorcycles + mopeds [1] |
| EU-27 | 2025 (rate); 2024 (shares) | 43.4 | 17.8 | 9.9 | 18.5 | 2024 shares; PTW = motorcycles only [1][19] |
| USA | 2024 | 115.4 | 18.0 | 2.8 | 15.9 | 39,254 deaths, population 340.1 m (rate derived) [22][24] |
| Americas region | 2021 | 140.9* | 17 | 3 | 27 | ~10% unknown user type [30] |
| Brazil / Mexico / Colombia | 2021 | 156.7* / 120.5* / 161.9* | n/a | n/a | n/a | [30] |
| Japan | 2024 (rate, 30 d); 2025 (shares, 24 h) | 26.0 | 34.9 | 12.0 | 18.7 | 2,547 deaths (24 h) in 2025 [31] |
| India | 2023 | ~121 (derived, UNVERIFIED) | 20.4 | n/a | 44.8 | 172,890 deaths, police data [32] |
| WHO South-East Asia region | 2021 | 160* | n/a | 12 | n/a | [29] |
| WHO Western Pacific region | 2021 | 150* | largest share | n/a | n/a | [29] |
| World | 2021 | 150* | 23 | 6 | 21 | 1.19 million deaths [29] |
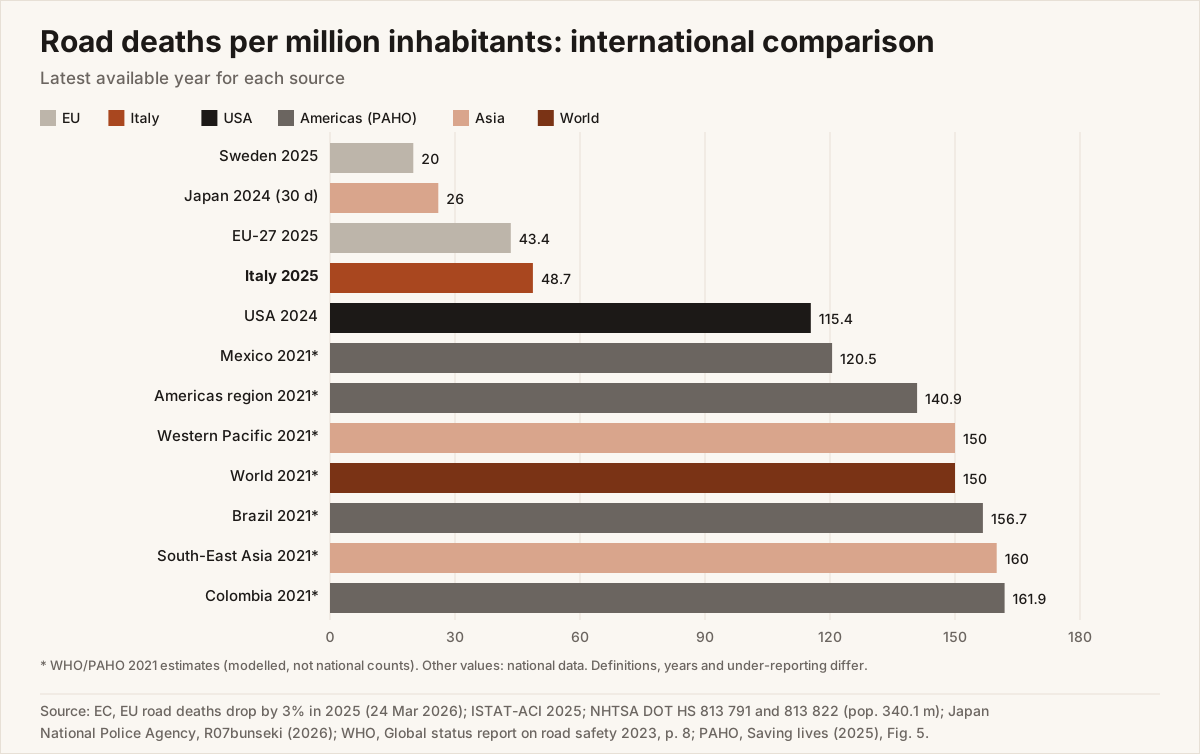 Source: EC [18]; ISTAT-ACI [1]; NHTSA [22][24]; Japan NPA [31]; WHO [29]; PAHO [30].
EU. About 19,400 people died on EU roads in 2025 (19,463 per ISTAT), 3% fewer than in 2024 and 15% fewer than in 2019 [18][1]. The best performers are Sweden (20 per million) and Denmark (23); the worst are Bulgaria (71), Romania (68) and Croatia (67) [18]. The EU target, set in 2018, is a 50% cut in deaths and serious injuries by 2030 and zero deaths by 2050 [18]; the commitment on serious injuries dates back to the Valletta Declaration of 29 March 2017 [21]. Italy has a lower pedestrian share than the EU average (14.6% against 17.8%) but a much higher powered two-wheeler share: motorcyclists were 27.4% of deaths in 2024, among the highest in the EU [19].
USA. There were 39,254 deaths in 2024, including 7,080 pedestrians (18%) and 1,103 cyclists (2.8%) [22][23][24]. The per-capita rate is more than twice Italy’s. Of pedestrian deaths, 84% occur in urban areas, 76% in the dark and 73% away from intersections [23]. NHTSA estimates 17,140 deaths in the first half of 2025 (−8.2%) [25]; GHSA projects 6,732 pedestrian deaths in 2025, 7% fewer than in 2024 but still 5% above 2019 [26]. Per capita, US cyclist deaths (3.2 per million in 2024 [24]) are lower than Italy’s (3.9 per million in 2025, derived), but with a far lower cycling mode share.
The Americas and Latin America. About 145,090 people died on roads in the PAHO Americas region (which also includes the US and Canada) in 2021 (14.09 per 100,000): 27% motorcyclists, 17% pedestrians and 3% cyclists [30]. Brazil (15.67 per 100,000), Colombia (16.19) and Mexico (12.05) have rates two and a half to over three times Italy’s [30]. Motorcyclists are the dominant problem there.
Asia. Extremes coexist. Japan has 2.60 deaths per 100,000 (2024, 30-day definition), but pedestrians (34.9%) and cyclists (12.0%) make up almost half of deaths, and 55.9% of those killed are aged 65 or over [31]. In India, 172,890 deaths were recorded in 2023: 44.8% on powered two-wheelers and 20.4% pedestrians [32]. In the WHO South-East Asia and Western Pacific regions the estimated rates are 16 and 15 per 100,000; in South-East Asia cyclists are 12% of deaths, and in the Western Pacific pedestrians are the largest share [29]. For China, WHO estimates 17.4 deaths per 100,000 in 2021 (about 248,000) (UNVERIFIED: read from a secondary compilation, not the WHO country profile).
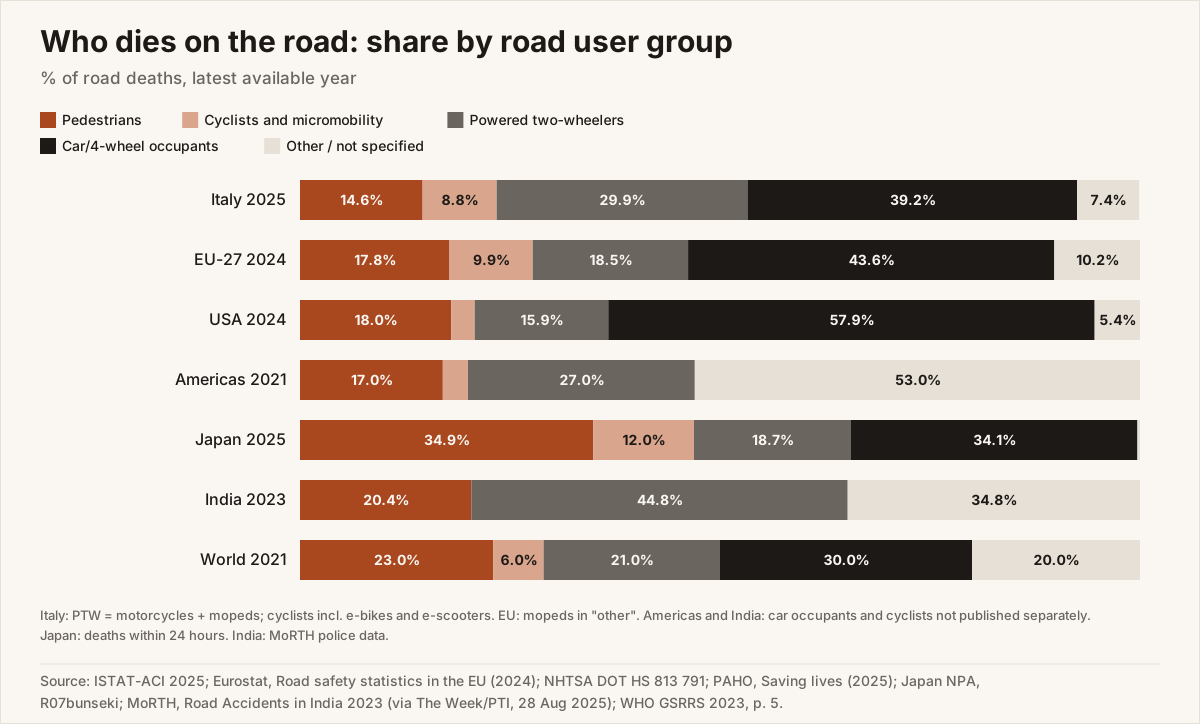 Source: ISTAT-ACI [1]; Eurostat [19]; NHTSA [22]; PAHO [30]; NPA [31]; MoRTH [32]; WHO [29].
Comparability note. (a) The EU, Italy and the US count deaths within 30 days; Japan’s headline figure is within 24 hours. (b) WHO and PAHO estimates correct for police under-reporting, which is large in many low- and middle-income countries; national figures for India and China are therefore not comparable with the estimates. (c) A per-capita rate does not measure risk per kilometre travelled: a country where few people walk can have few pedestrian deaths per capita and a high risk per trip. (d) Categories differ (e-bikes, e-scooters and mopeds fall under different headings). (e) Japan’s 30-day count (3,221 in 2024, IRTAD via NPA) is about 20% above the 24-hour figure; the user-group shares shown are 24-hour.
5. Rules and recent developments
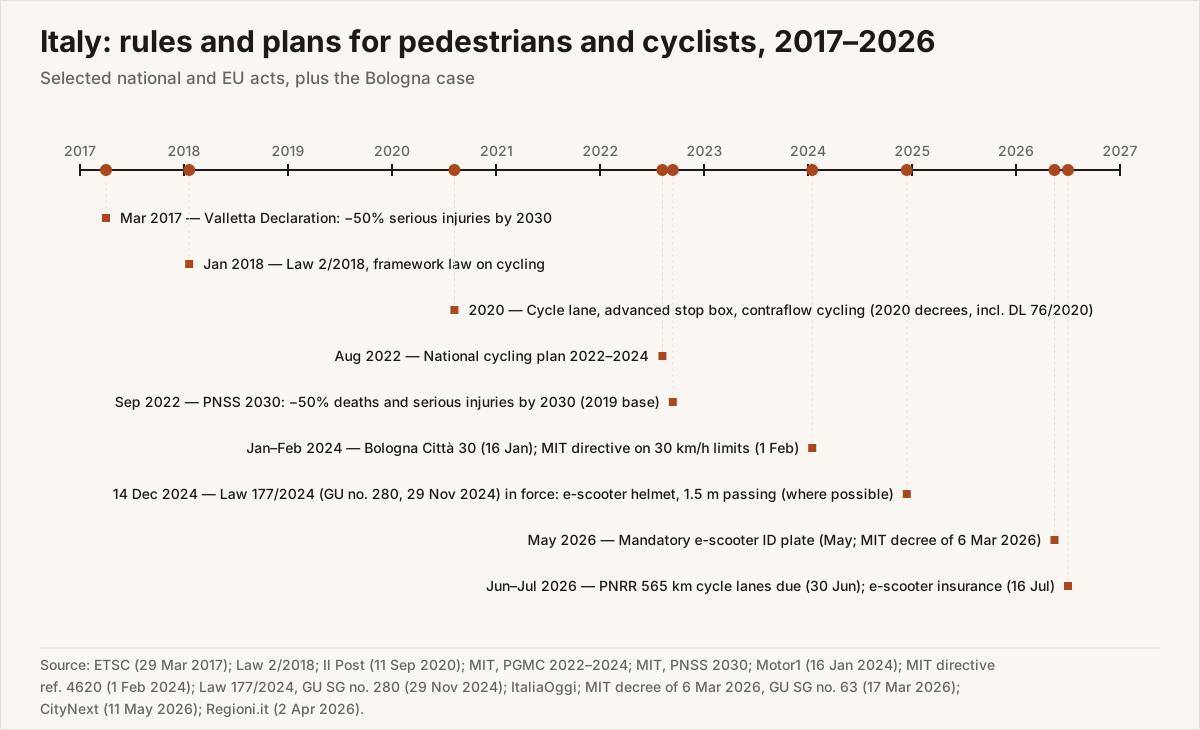 Source: [8][10][11][12][14][15][16][17][21][36][37][38].
5.1 Highway Code: Law 177/2024
Law no. 177 of 25 November 2024 (Gazzetta Ufficiale, General Series no. 280 of 29 November 2024) has been in force since 14 December 2024 [37][9]. The measures most relevant to pedestrians and cyclists:
- Passing cyclists. Article 148(9-bis) requires motor vehicles to pass cyclists “with adequate lateral clearance, according to their respective speeds and the size of the motor vehicle”, keeping, “where road conditions allow, a safety distance of at least 1.5 metres” [7][8]. The conditional clause makes the rule hard to enforce.
- Cyclists. Cyclists may no longer use bus lanes; motor vehicles must give way to cyclists on cycle lanes marked with a broken line; new rules apply in advanced stop boxes at signals [8].
- E-scooters. Helmets are mandatory for all ages from 14 December 2024; e-scooters may only use urban roads with limits up to 50 km/h [9][20]; an identification plate has been mandatory since mid-May 2026 (Ministry of Transport decree of 6 March 2026) [38][10] and third-party insurance since 16 July 2026 [10]. The technical speed limit remains 20 km/h [10]. Fines issued to e-scooter riders in provincial capitals numbered 24,139 in 2025, more than three times the 2024 figure [3].
5.2 Città 30 and the MIT directive
Bologna extended a 30 km/h limit to about 70% of the streets in its built-up area from 16 January 2024 [12]. Shortly afterwards, a directive from the Ministry of Infrastructure and Transport (MIT) (ref. no. 4620 of 1 February 2024, previewed to the press on 24 January) stated that the 50 km/h limit may be lowered only on “expressly identified roads or road sections”, with documented justification (crash history over the last three years, schools, hospitals, historic or residential character) and periodic review, ruling out a citywide limit [11].
The City of Bologna’s 2025 report compares 2025 with the 2022–2023 mean [13]:
- deaths 12 against 19.5 (−38.5%); 2024 had 10;
- crashes 2,457 against 2,827 (−13.1%); injured 2,312 against 2,424 (−4.6%);
- pedestrians involved −12.9%; cyclists involved +20.3%, with measured cycle flows +19.1%;
- weekday motor traffic from about 226,000 to 205,000 vehicles (about −9%);
- 9 of the 12 fatal crashes in 2025 were on streets still at 50 km/h; 7 pedestrians were killed in 2025 (0 in 2024).
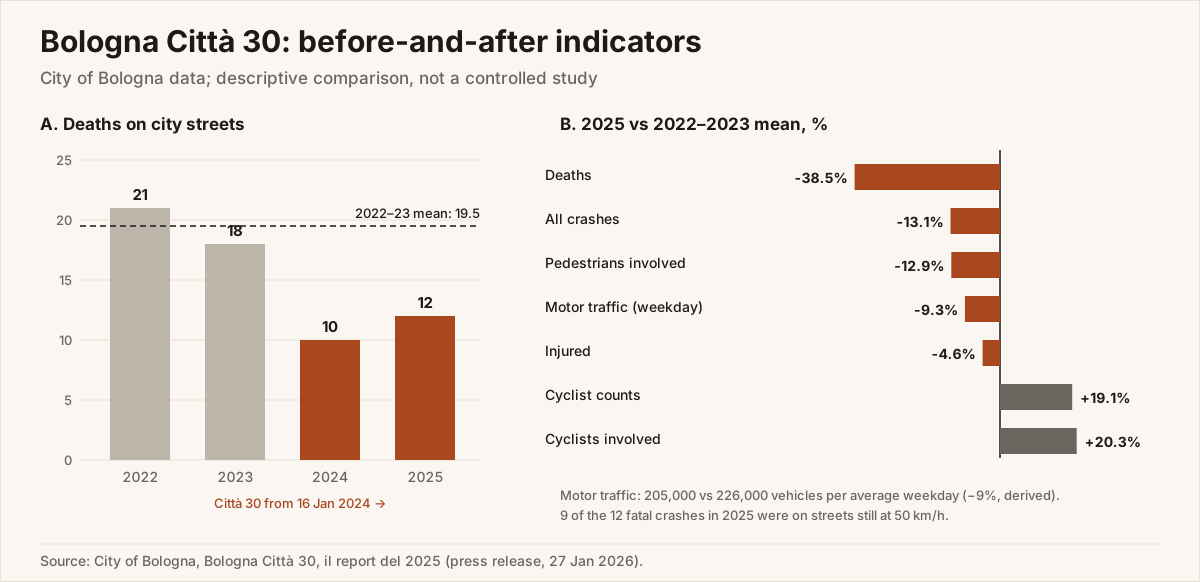 Source: City of Bologna, 2025 report [13].
These are descriptive municipal data, not a controlled study: two years, small numbers and possible regression to the mean. The direction is, however, consistent with Brussels, where in the first quarter of the citywide 30 km/h limit (2021) measured mean speeds fell by 7% to 19% and deaths and serious injuries were 30 against a five-year average of 44.2 for the same quarter [35].
5.3 PNSS 2030 and cycling plans
The PNSS 2030 aims to cut deaths and serious injuries by 50% by 2030 and to zero by 2050 [14]; the baseline is 2019, so the 2030 target is 1,587 deaths [1]. The plan lists children and adolescents, young drivers, people over 65, cyclists, pedestrians and powered two-wheeler users as the highest-risk groups, and among the actions for local authorities calls for more 30 km/h zones in urban centres [14]. Reaching the target from 2025 would require an 11.2% fall per year (derived), against the 6.1% a year that ISTAT gives as the required pace over the whole 2019–2030 period [1]. Serious injuries were 16,740 in 2024, only 4.9% below 2019 [1].
For cycling, Law 2/2018 set the national framework [36]; the National Cycling Plan 2022–2024 was approved in August 2022 [15]; and in 2020 cycle lanes, advanced stop boxes and contraflow cycling entered the Highway Code [17]. Italy’s Recovery Plan (PNRR, measure M2C2-4.1) funds at least 565 km of new urban and metropolitan cycle lanes by 30 June 2026, with €200 million (€150 million PNRR and €50 million national funds), a target updated in April 2026 [16]. Completion status as of October 2026 has not been verified.
6. Engineering reading: what works
Speed. It is the most robust factor. According to Tefft (2011), the average risk of death for a pedestrian struck by a vehicle (averaged over ages; risk rises steeply with age) is 10% at about 37 km/h, 25% at 51 km/h, 50% at 68 km/h and 90% at 93 km/h [33]. Moving impact speeds from 50 to 30 km/h puts the collision in the low-risk range. A limit alone is not enough, though: in Bologna traffic volumes and street design changed together with the limit, and most fatal crashes happened on streets that stayed at 50 km/h [13].
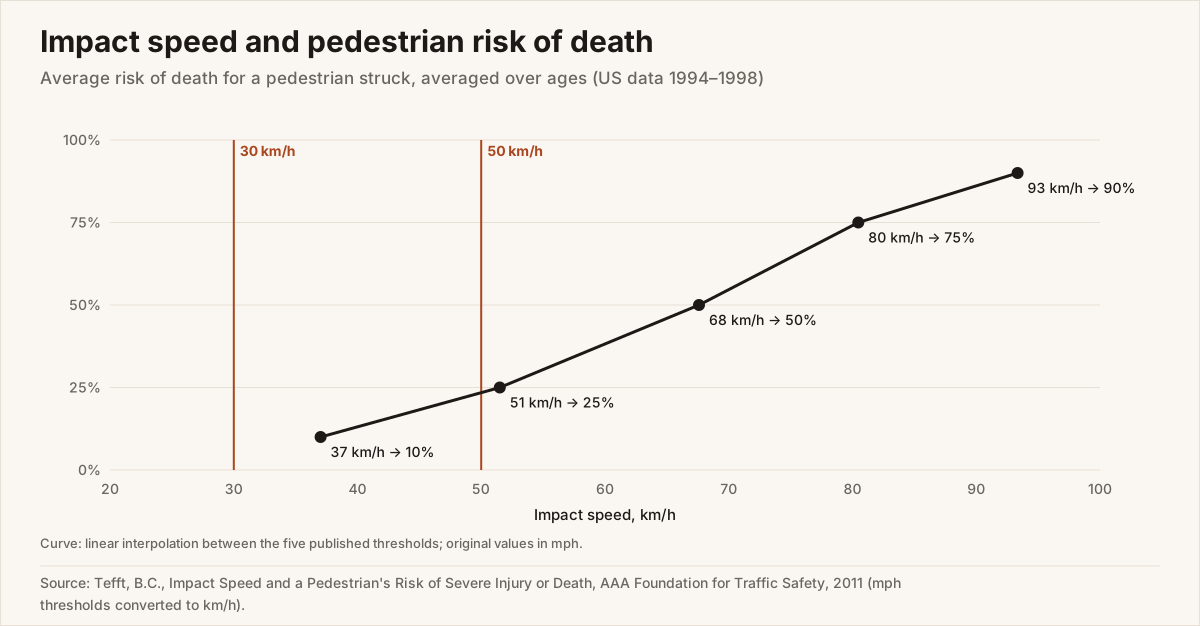 Source: Tefft, AAA Foundation, 2011 [33].
Crossings. The countermeasures with the strongest evidence, as summarised by IIHS-HLDI (April 2026) [34]:
- refuge islands: about −50% pedestrian crashes at marked crosswalks;
- raised crosswalks: −46% injury pedestrian crashes;
- rectangular rapid-flashing beacons (RRFB): −47% pedestrian crashes;
- pedestrian hybrid beacons (PHB): −45% injury or fatal crashes;
- leading pedestrian intervals (LPI): −19% pedestrian crashes;
- intersection lighting: −42% night-time injury pedestrian crashes;
- reduced curb radius: −37%.
These factors come mostly from North American and Northern European studies. Use them as orders of magnitude rather than transferring them as-is to Italian streets.
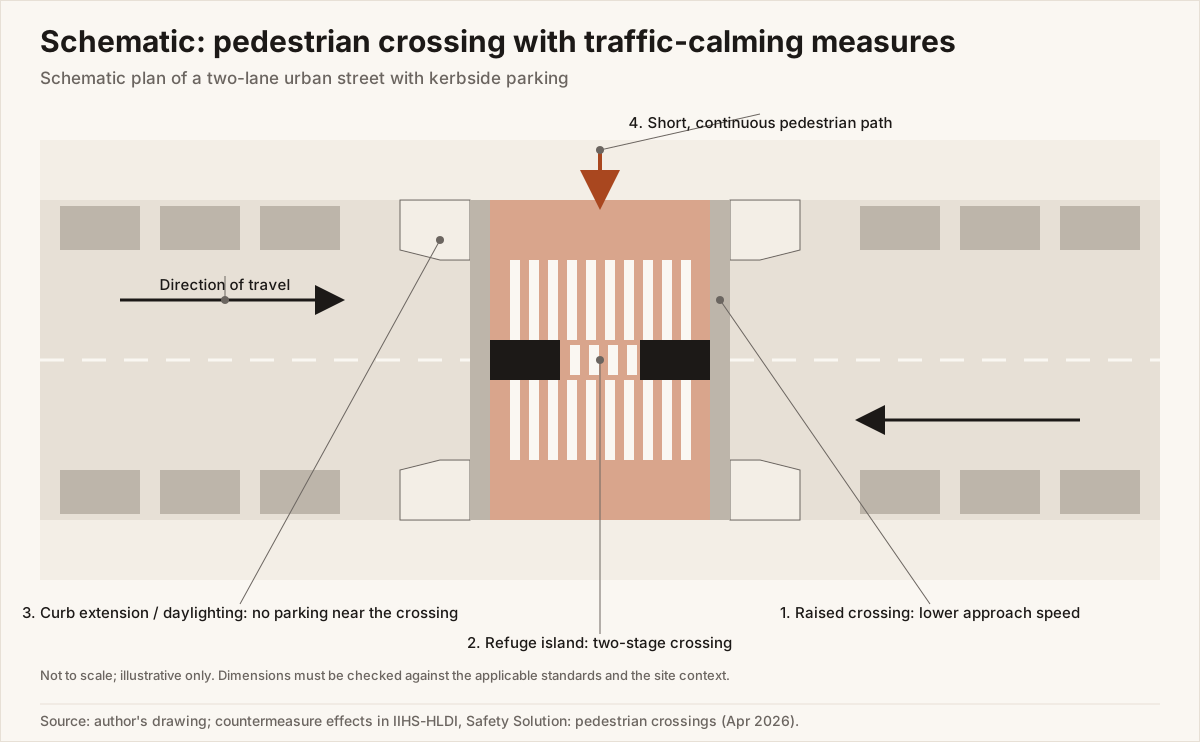 Source: author’s drawing; countermeasure effects from IIHS-HLDI [34].
Intersections and visibility. Where on-street parking is heavy, clearing parking from the metres next to a crossing (daylighting) and building out the kerb shortens the crossing and makes pedestrians visible. For cyclists, the Highway Code has offered cycle lanes, advanced stop boxes and contraflow cycling since 2020 [17]; their effect depends on network continuity and on separation where speeds and volumes are high.
Powered two-wheelers. In Italy, motorcyclists are almost three in ten road deaths [1][19]. Pedestrian and cycling schemes that ignore motorcycles and scooters, for example on multi-lane urban arterials, leave the largest group of vulnerable users unaddressed.
7. Limits of the data
- Exposure. ISTAT publishes deaths per capita, not per kilometre walked or cycled. The 2025 rise in cyclist deaths cannot be separated from growth in cycling without distance data.
- Back-calculation and categories. In Figure 2 the 2010 and 2023 pedestrian values are back-calculated from percentage changes. The cyclist series uses published counts and includes e-bikes and e-scooters, which ISTAT has published as separate headings since 2023; the 2010 value (263) comes from that year’s ISTAT report, before the series was revised, and gives −3.8% rather than the −4.5% ISTAT now reports.
- Age. ISTAT’s 2025 report does not give pedestrian deaths by age; the microdata are needed.
- Serious injuries. The latest figure (MAIS3+) is for 2024 [1]; serious injuries are the most sensitive indicator for pedestrians and cyclists.
- International comparisons. Definitions (24 h vs 30 days), under-reporting and modelled estimates (§4) make comparisons indicative.
- Travel surveys. Audimob (trips, ages 14–85) and NHTS or ACS (trips, or commuting only) measure different things; surveys tend to undercount short walk trips.
- Local evaluations. The Bologna figures are municipal, over two years and uncontrolled; read them as a signal, not a causal estimate.
8. Practitioner checklist
- Use the latest ISTAT-ACI edition (currently 2025 data, published July 2026) and always state the year and the 30-day definition.
- Separate pedestrians, conventional cyclists, e-bike riders, e-scooter riders and powered two-wheeler users: their trends differ.
- Normalise by exposure where possible (pedestrian and cycle counts, local mode share, vehicle-km), not only per capita.
- Analyse at least 3–5 years of geocoded crashes; in before-and-after comparisons, control for regression to the mean.
- Check operating speed (85th percentile) before proposing a limit; a limit alone does not change speeds.
- Document the justification for every 30 km/h limit against the MIT directive criteria (crash history, trip attractors, road characteristics) [11].
- At crossings, consider in this order: lower approach speed (raised crossing), shorter crossing distance (refuge island, kerb build-out), visibility (daylighting, lighting), control (LPI, pedestrian-actuated signals) [34].
- For cyclists, check network continuity and separation; apply cycle lanes, advanced stop boxes and contraflow cycling correctly [17]; consider what the 1.5 m passing clearance means for the cross-section [7].
- Always include powered two-wheelers in vulnerable-road-user analyses.
- Document sources, years, definitions and assumptions so that a reviewer can reproduce every number.
For an independent review of a study like this, see peer review or get in touch.
Sources
- ISTAT-ACI, Incidenti stradali – Anno 2025 (Road accidents, 2025), report, 24 July 2026. Tables (Prospetti) 1, 2, 3, 4; Fig. 7; vulnerable users section. https://www.istat.it/wp-content/uploads/2026/07/REPORT_INCIDENTI_STRADALI_2025.pdf
- ISTAT-ACI, Incidenti stradali – Anno 2024 (Road accidents, 2024), report, July 2025. Tables 1, 2, 4; Fig. 7. https://www.istat.it/wp-content/uploads/2025/07/REPORT_INCIDENTI_STRADALI_2024.pdf
- ACI, ACI-ISTAT: gli incidenti stradali 2025, press release, July 2026. https://aci.gov.it/comunicati-stampa/aci-istat-gli-incidenti-stradali-2025/
- Isfort, 22° Rapporto sulla mobilità degli italiani “Eppur si muove” – Summary (Audimob survey), 20 November 2025, pp. 3, 5–7, 10 (Graph 4, Graph 7, Table 1). https://www.isfort.it/wp-content/uploads/2025/11/22-RapportoMobilita_Sintesi.pdf
- ISTAT, Indicatori del parco veicolare – Anno 2024 (Vehicle fleet indicators, 2024), February 2026, p. 3. https://www.istat.it/wp-content/uploads/2026/02/Statistica-Today_Indicatori-del-parco-veicolare_Anno-2024.pdf
- ISTAT, Ambiente urbano – Anno 2023 (Urban environment, 2023), 8 July 2025 (cycle paths in provincial capitals). https://www.istat.it/wp-content/uploads/2025/07/Ambiente-urbano_Anno-2023.pdf
- ACI, Codice della Strada, art. 148 – Sorpasso (Highway Code, art. 148 – Overtaking), para. 9-bis. https://aci.gov.it/codice-della-strada/art-148/
- ItaliaOggi, Codice della strada, ecco cosa cambia per i ciclisti dal 14 dicembre, December 2024. https://www.italiaoggi.it/diritto-e-fisco/giustizia/codice-della-strada-ecco-cosa-cambia-per-i-ciclisti-dal-14-dicembre-yjnafjik
- Rinnovabili.it, Nuovo codice della strada: cambiano regole per monopattini e bici, 16 December 2024. https://www.rinnovabili.it/mobilita/smart-mobility/nuovo-codice-della-strada-monopattini/
- CityNext, Monopattini: targa obbligatoria dal 17 maggio, assicurazione rinviata al 16 luglio, 11 May 2026. https://citynext.it/2026/05/11/nuovi-obblighi-monopattini-maggio-2026-targa-assicurazione-operatori/
- MIT, Directive under Article 142(2) of the Highway Code on urban speed limits (Direttiva sulla disciplina dei limiti di velocità nell’ambito urbano), ref. no. 4620 of 1 February 2024, text via Lexitalia: https://www.segretaricomunalivighenzi.it/13-02-2024-limite-di-30-km-h-nei-centri-urbani/01/02/2024 ; secondary source: Il Fatto Quotidiano, Città a 30 km/h, ecco la direttiva del ministero di Salvini, 24 January 2024. https://www.ilfattoquotidiano.it/2024/01/24/citta-a-30-km-h-ecco-la-direttiva-del-ministero-di-salvini-il-limite-solo-in-alcune-strade-e-deve-essere-motivato/7420836/
- Motor1 Italia, A Bologna da oggi al via i limiti a 30 km/h, 16 January 2024. https://it.motor1.com/news/704763/inizio-limiti-bologna-30-km-h/
- City of Bologna, Bologna Città 30, il report del 2025, press release, 27 January 2026. https://www.comune.bologna.it/novita/comunicati-stampa/bologna-citta-30-il-report-del-2025
- MIT, Piano Nazionale Sicurezza Stradale 2030 (National Road Safety Plan 2030), September 2022, https://mit.gov.it/nfsmitgov/files/media/progetti/2022-09/20220916_Piano%20Nazionale%20Sicurezza%20Stradale_Def.pdf ; slide summary, slides 8–9: https://www.bolognacitta30.it/wp-content/uploads/2023/12/Piano-Nazionale-Sicurezza-Stradale-2030_slide.pdf
- MIT, Piano Generale della Mobilità Ciclistica urbana e extraurbana 2022–2024 (National Cycling Plan 2022–2024), August 2022. https://www.mit.gov.it/nfsmitgov/files/media/notizia/2022-08/PG%20Mobilit%C3%A0%20Ciclista%20e%20allegati.pdf
- Regioni.it, PNRR: Regioni, 565 chilometri di piste ciclabili previsti in città, 2 April 2026. https://www.regioni.it/comunicato-stampa/2026/04/02/pnrr-regioni-565-chilometri-di-piste-ciclabili-previsti-in-citta-663814/
- Il Post, Le nuove norme per le biciclette e le auto elettriche, 11 September 2020. https://www.ilpost.it/2020/09/11/le-nuove-norme-per-le-biciclette-e-le-auto-elettriche/
- European Commission, DG MOVE, EU road deaths drop by 3% in 2025, 24 March 2026. https://transport.ec.europa.eu/news-events/news/eu-road-deaths-drop-3-2025-2026-03-24_en
- Eurostat, Road safety statistics in the EU, Statistics Explained (2024 data, extracted April 2026). https://ec.europa.eu/eurostat/statistics-explained/index.php?title=Road_safety_statistics_in_the_EU
- ETSC, Ranking EU progress on road safety – 19th Annual Road Safety Performance Index (PIN) Report, June 2025, pp. 32–33. https://etsc.eu/wp-content/uploads/ETSC-2025-Annual-PIN-Report-DIGITAL-V2.pdf
- ETSC, Transport ministers call for target to reduce serious road injuries, 29 March 2017. https://etsc.eu/transport-ministers-call-for-target-to-reduce-serious-road-injuries/
- NHTSA, Overview of Motor Vehicle Traffic Crashes in 2024, DOT HS 813 791, April 2026, Table 3. https://crashstats.nhtsa.dot.gov/Api/Public/ViewPublication/813791
- NHTSA, Pedestrians: 2024 Data, Traffic Safety Facts, DOT HS 813 818, pp. 1–3, 10–11. https://crashstats.nhtsa.dot.gov/Api/Public/ViewPublication/813818
- NHTSA, Bicyclists and Other Cyclists: 2024 Data, DOT HS 813 822, pp. 1–2, 5, 10 (Table 6). https://crashstats.nhtsa.dot.gov/Api/Public/ViewPublication/813822
- NHTSA, NHTSA reports sharp drop in traffic fatalities in first half of 2025, 16 September 2025. https://www.nhtsa.gov/press-releases/nhtsa-reports-sharp-drop-traffic-fatalities-first-half-2025
- GHSA, Pedestrian Traffic Fatalities by State: 2025 Preliminary Data, July 2026, pp. 4, 6–7, 27, 32. https://www.ghsa.org/sites/default/files/2026-07/Pedestrian%20Traffic%20Fatalities%20by%20State%202025%20Data.pdf
- FHWA, Summary of Travel Trends: 2022 National Household Travel Survey, Table 4-2, p. 27. https://nhts.ornl.gov/assets/2022/pub/2022_NHTS_Summary_Travel_Trends.pdf
- US Census Bureau, 2024 ACS 1-year, Table S0801, via New Geography, Annual US report: means of work access. https://mail.newgeography.com/content/008668-annual-us-report-means-work-access
- WHO, Global status report on road safety 2023, December 2023, pp. viii, 3, 5–6, 8, 18. https://assets.bbhub.io/dotorg/sites/64/2023/12/WHO-Global-status-report-on-road-safety-2023.pdf
- PAHO, Saving lives: promoting a safe systems approach to road safety in the Americas, ch. 1 (Fig. 5), 2025. https://www.paho.org/pub/en/saving-lives-promoting-safe-systems-approach-road-safety-americas/1-road-traffic-deaths-crashes.html
- National Police Agency of Japan, Traffic accidents in 2025 (令和7年における交通事故の発生状況について), 26 February 2026. https://www.npa.go.jp/publications/statistics/koutsuu/jiko/R07bunseki.pdf
- MoRTH (India), Road Accidents in India 2023, https://morth.nic.in/sites/default/files/Road-Accident-in-India-2023-Publications.pdf (not consulted directly); figures as reported by The Week/PTI, 28 August 2025. https://www.theweek.in/wire-updates/business/2025/08/28/del82-biz-road-accidents-report.html
- Tefft, B.C., Impact Speed and a Pedestrian’s Risk of Severe Injury or Death, AAA Foundation for Traffic Safety, September 2011. https://aaafoundation.org/impact-speed-pedestrians-risk-severe-injury-death/
- IIHS-HLDI, Safety Solution: pedestrian crossings, April 2026. https://www.iihs.org/media/39aa08e0-a985-4534-8630-ea2d7c318b8d/MvL4ng/Topics/Research%20summaries/IIHS-HLDI%20Safety%20Solution—pedestrian%20crossings.pdf
- BX1, Bruxelles : bilan positif des 30 km/h généralisés, 14 May 2021. https://bx1.be/categories/news/bruxelles-bilan-positif-des-30km-h-generalises/
- Law no. 2 of 11 January 2018 (framework law on cycling), text hosted by Astrid. https://www.astrid-online.it/static/upload/legg/legge-11-gennaio-2018--n2.pdf
- Law no. 177 of 25 November 2024 (Legge 25 novembre 2024, n. 177), Interventi in materia di sicurezza stradale e delega al Governo per la revisione del codice della strada, Gazzetta Ufficiale, General Series no. 280 of 29 November 2024 (code 24G00199). https://www.gazzettaufficiale.it/eli/gu/2024/11/29/280/sg/pdf
- MIT, Directorate-General for Motorisation, decree of 6 March 2026 (platform for issuing e-scooter identification plates), Gazzetta Ufficiale, General Series no. 63 of 17 March 2026 (code 26A01262), p. 14. https://www.gazzettaufficiale.it/eli/gu/2026/03/17/63/sg/pdf
Need this applied to your corridor?
Send the study scope and the data you have. You will get a reply within two working days.
Discuss a project